

Tools
Color Tools
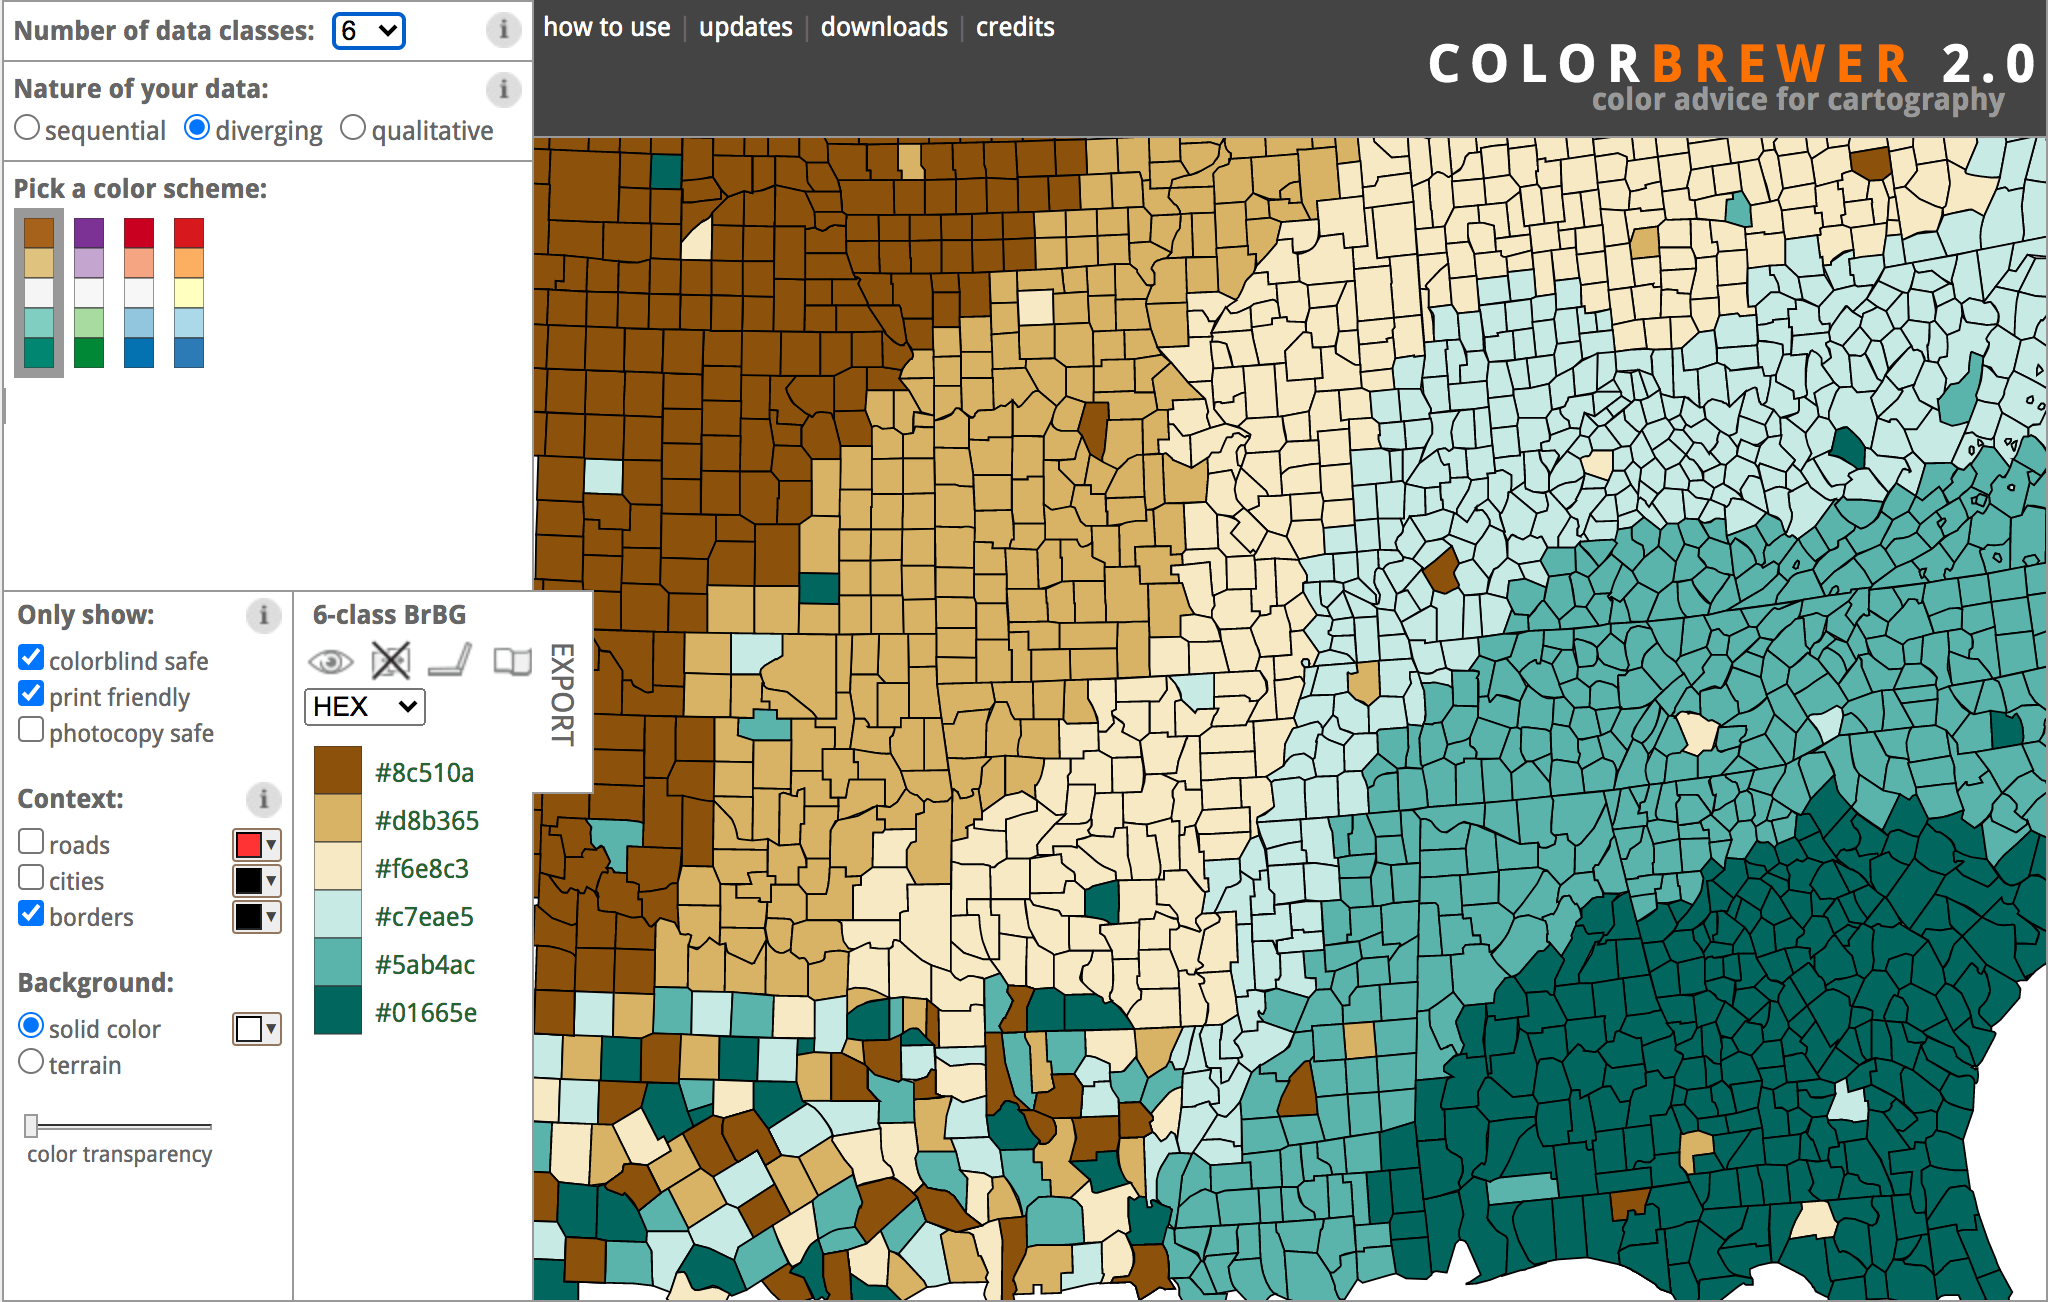
Colormoves
What it is: An interactive online tool equipped with a selection of pre-made, designer-crafted colormaps, a viewing window for testing colormaps on your own data, and an adjustment window for simple and fast colormap building. The adjustment window allows a user to see where the density of their data lies, thereby providing for easy drag-and-drop colormap allocation, which shows the results on data (in the viewing window) in real-time. Once a user creates a new map, they can export that map in the relevant format for any major vis program.
When to use: Use when you are looking for a quick, easy, and effective way to explore your data interactively.
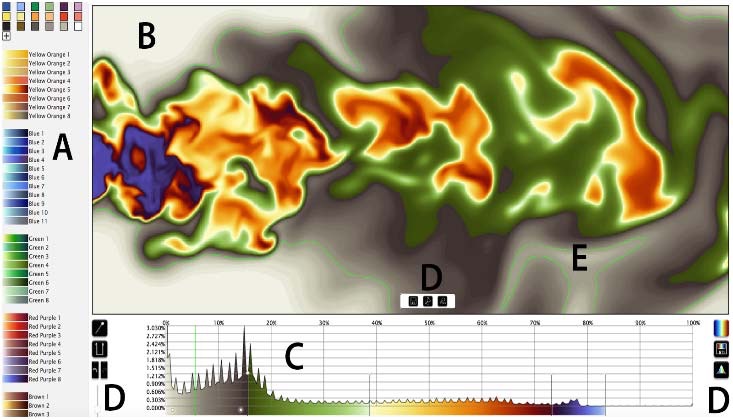
CCC Tool
What it is: CCC Tool is an online colormap crafting tool for users with significant experience who are looking for advanced control over every aspect of their map. The tool provides a starting set of maps to work off of in addition to several extremely fine-tune metrics that enable a user to see each hue point along a map in three different colorspaces at once. The maps can be exported in any relevant format for vis programs. A user can also import their own starting map and adjust it within CCCTool.
When to use: Use only if you need extremely detailed control over a colormap. If you are interested in adding minute control points and adjusting each point until satisfied, this is the tool for you.
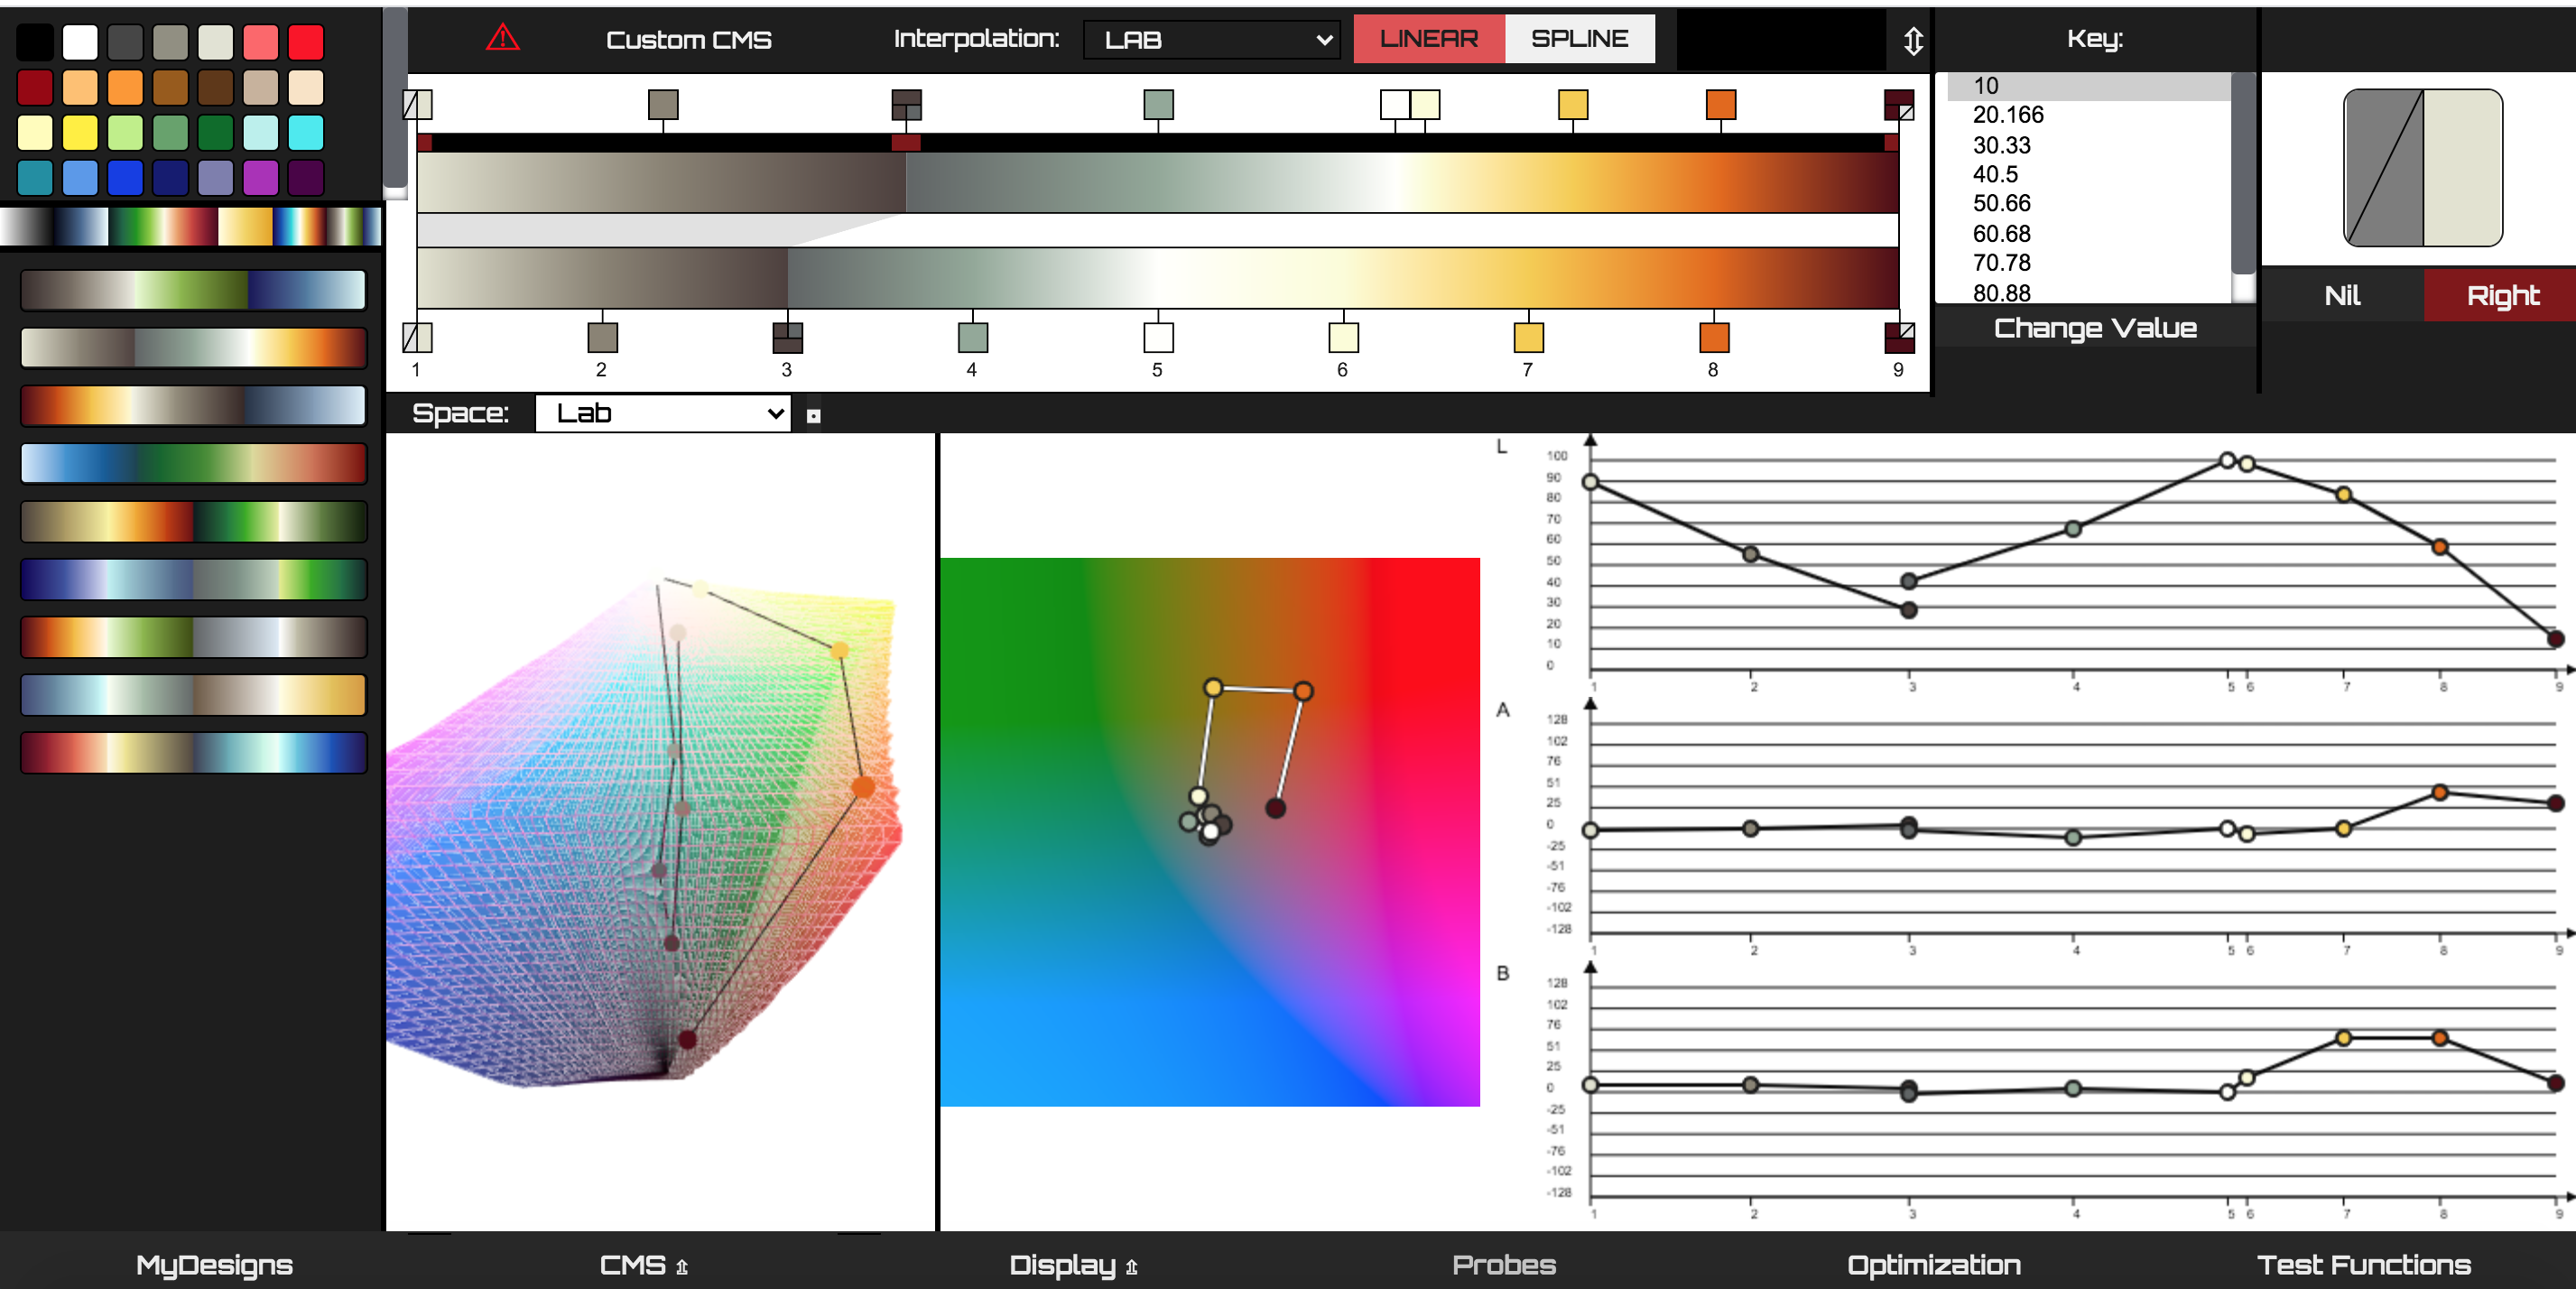
David Johnstone
What it is: A color picker and gradient creation tool for a variety of color spaces that interpolates between discrete hues to create perceptually uniform continuous colormaps.
When to use: Good for interpolating the distance between two specific hues in a perceptually uniform space.
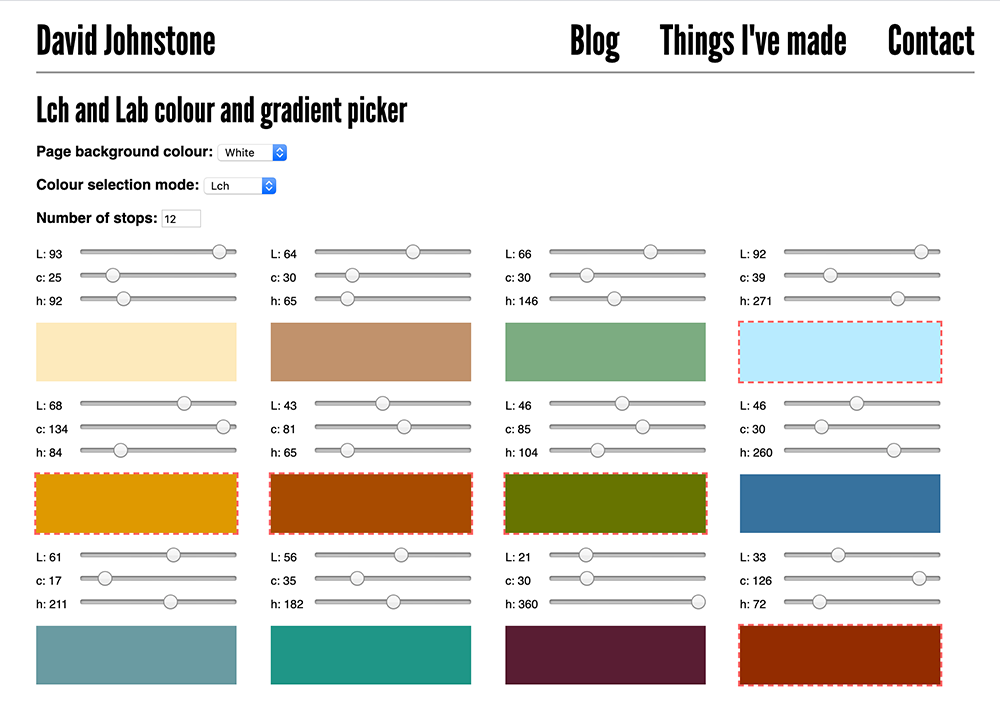
Color Brewer
What it is: ColorBrewer is an online colormapping tool for categorical data with one permanent data set showing counties in the Eastern United States. The tool allows a user to define parameters such as number of data classes, nature of their data, distribution considerations, and context. Rather than uploading their own data, a user can request a colormap based on predetermined needs and test it before applying it to their own. It is also colorblind compliant and allows a user to make sure their map will print correctly.
When to use: Use for a very quick and easy test of colormap function. This tool perhaps provides a first step to identifying the type of color scheme that would be appropriate for a certain data set under certain restrictions with very little effort.
Colorgorical
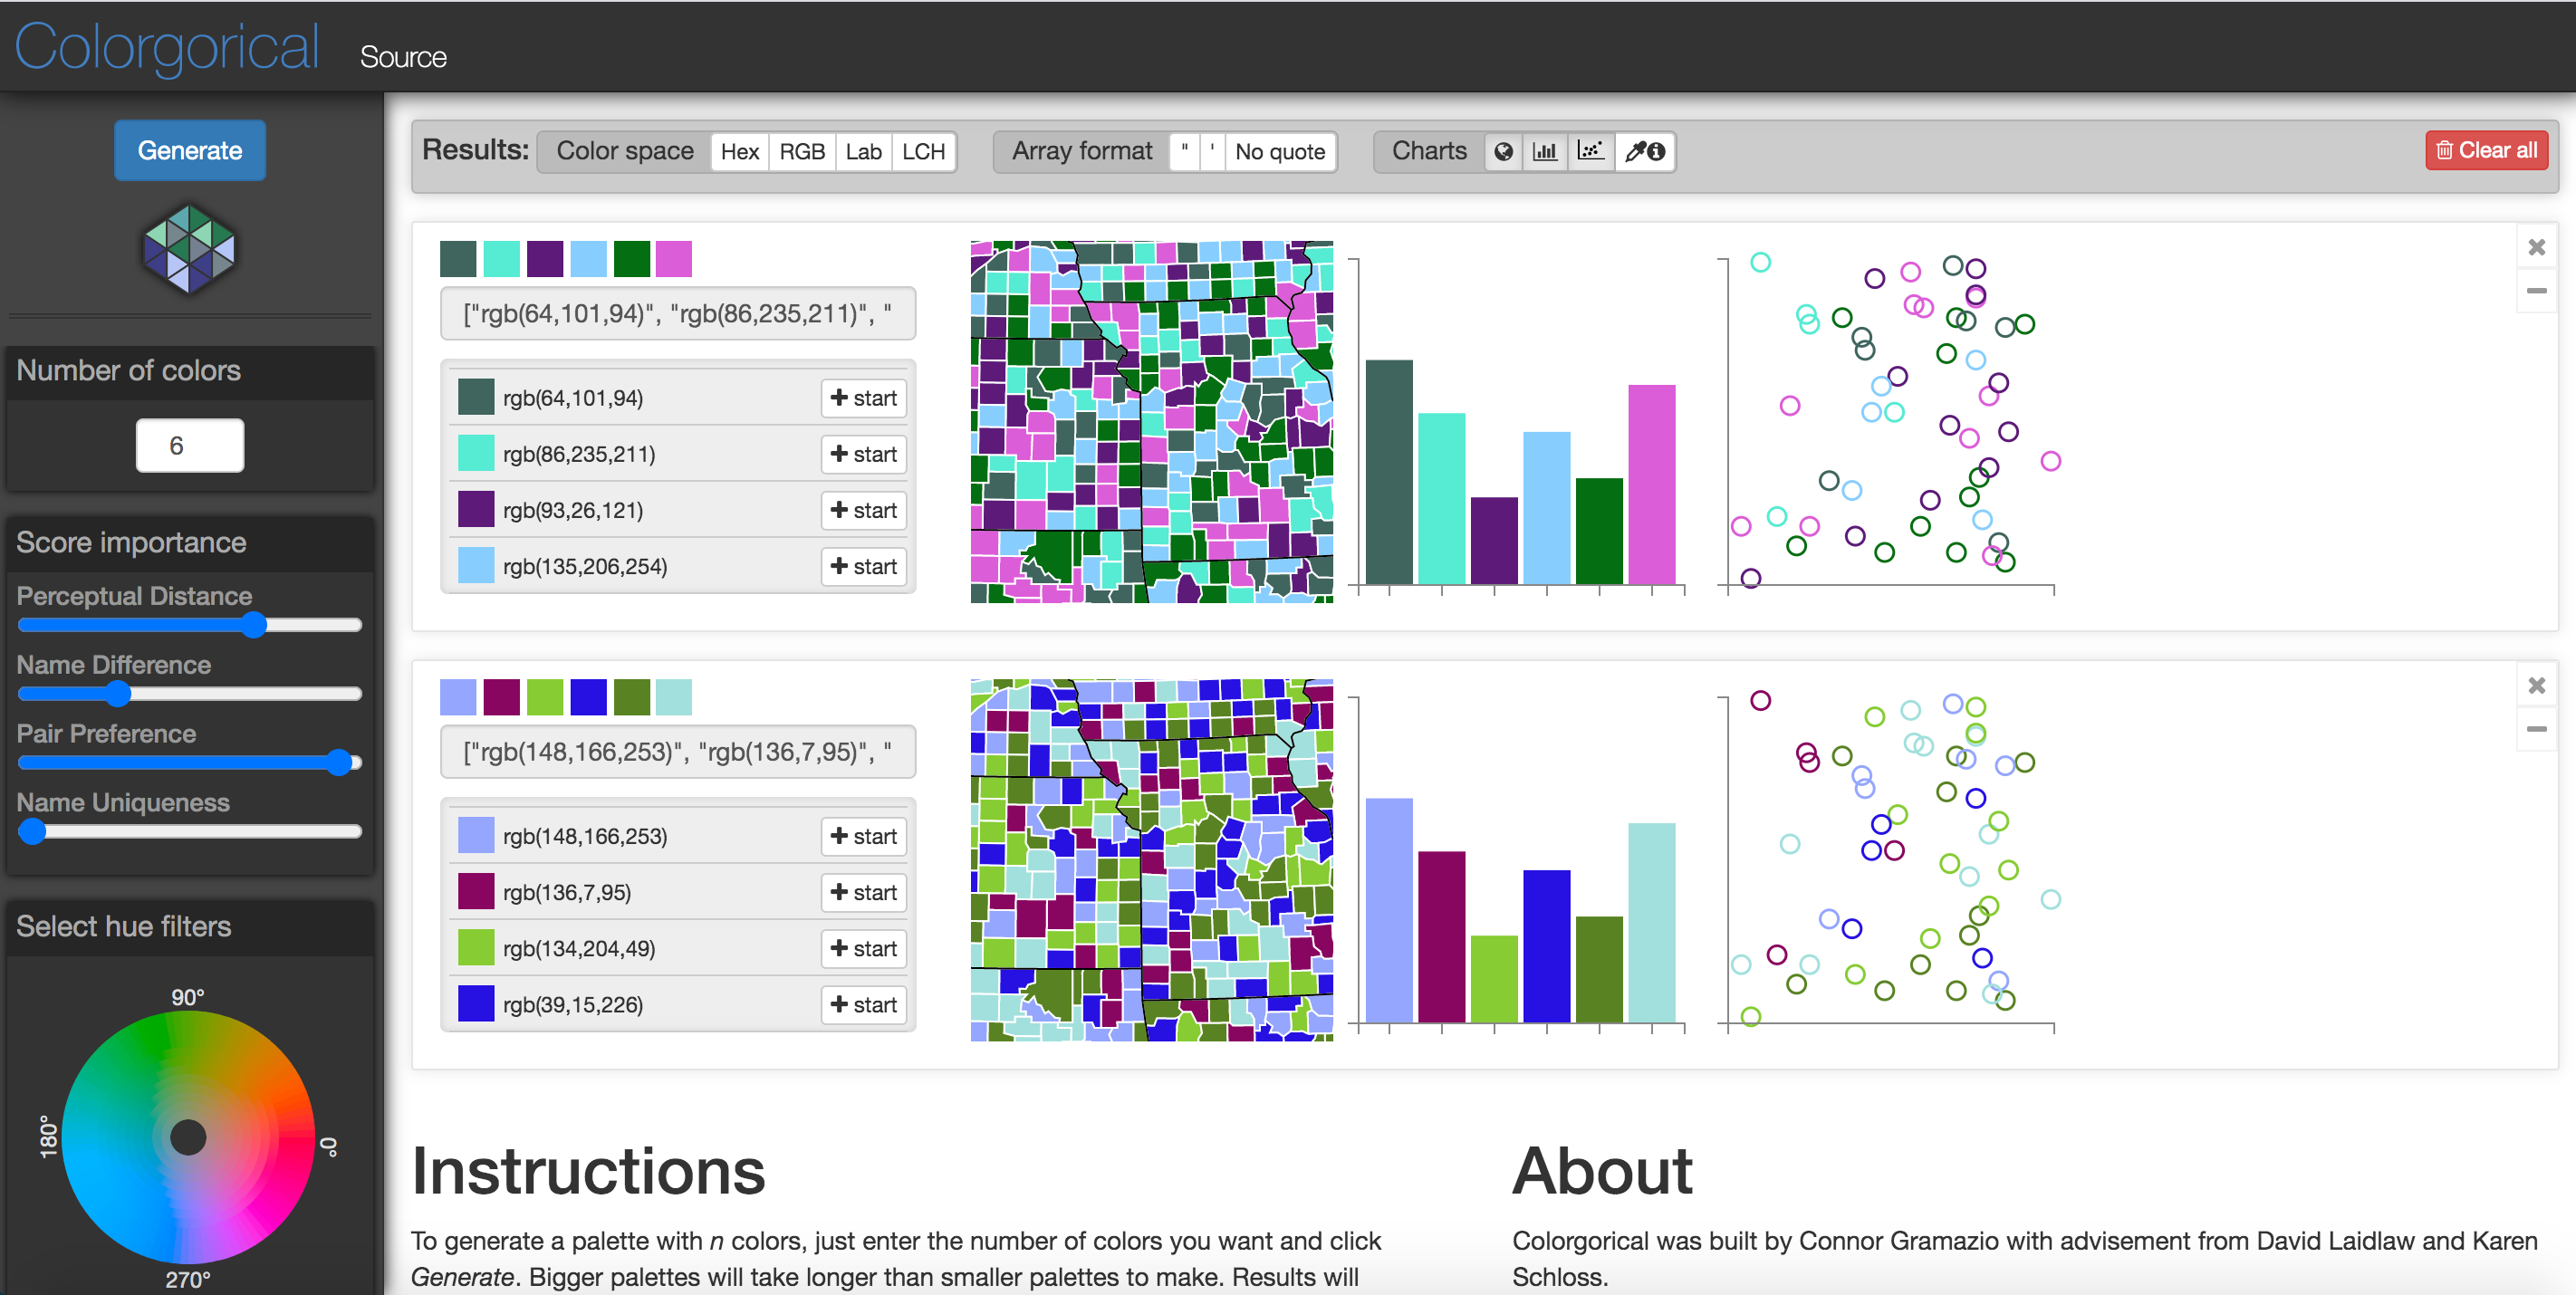
What it is: Colorgorical is an online tool used to automatically generate color palettes for categorical scientific visualization based on a set of pre-defined preferences. A user can define parameters such as: perceptual distance in colorspace, name difference, pair preference (how well the colors go together), name uniqueness, and lightness range. The user can also identify specific sections of the colorwheel from which the program should compose a palette, as well as add starting, or "seed" colors for the palette.
When to use: Use when you need to generate a palette of colors for categorical data that both look aesthetically pleasing together and are also sufficiently descriminable from each other.
Color Loom
What it is: Colorloom is a tool developed by the Sculpting Vis Collaborative and inspired to mimic palette creation in the arts. The tool extracts a selection of hues from images and enables users to create continuous colormaps by dragging these extracted hues into a desired order, all within the same interface. These colormaps can be exported in a variety of formats for use in major visualization software.
When to use: Best for generating non-traditional colormaps semantically tied to specific imagery. For example, a continuous colormap for ocean eddy temperature drawn from images of the ocean.
Kenneth Moreland
What it is: General advice on colormapping from one of the foremost experts in colormap research.
Visualization Tools
Visualization-by-Sketching
What it is: A direct-manipulation user interface for designing new data visualizations. The goals are twofold: First, make the process of creating real, animated, data-driven visualizations of complex information more accessible to artists, graphic designers, and other visual experts with traditional, non-technical training. Second, support and enhance the role of human creativity in visualization design, enabling visual experimentation and workflows similar to what is possible with traditional artistic media.
Paraview
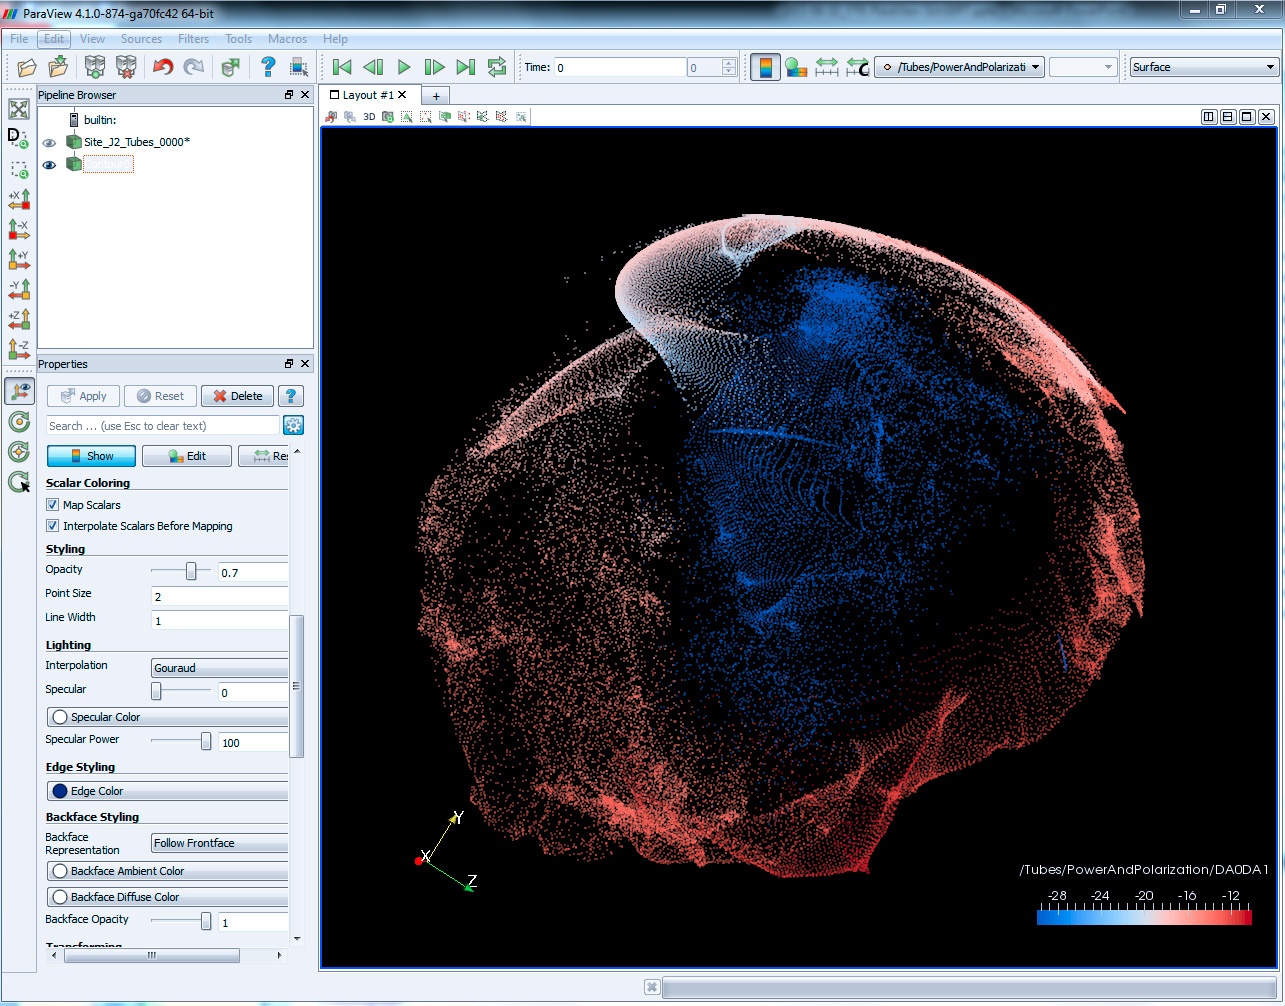
What it is: ParaView is an open-source, multi-platform data analysis and visualization application. ParaView users can quickly build visualizations to analyze their data using qualitative and quantitative techniques. The data exploration can be done interactively in 3D or programmatically using ParaView’s batch processing capabilities. ParaView was developed to analyze extremely large datasets using distributed memory computing resources. It can be run on supercomputers to analyze datasets of petascale as well as on laptops for smaller data. ParaView is an application framework as well as a turn-key application.
When to use: When you need to visualize a large data set.
Artifact Based Rendering
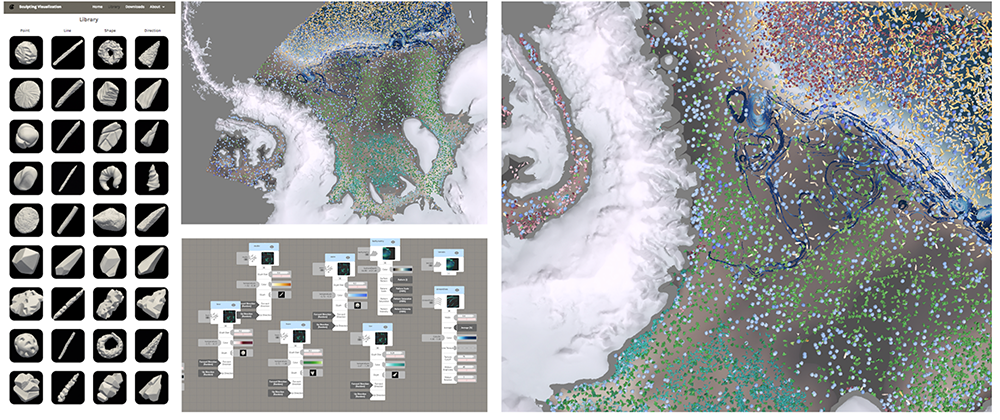
What it is: Artifact Based Rendering (ABR) is a framework that includes tools and processes to enable digital visualizations to incorporate physical media. Created with artists and designers in mind, ABR is a technical foundation and the input channel for Sculpting Visualization’s project to enrich the visual vocabulary of scientific visualization through hand-crafted or naturally ocurring objects. ABR bridges key barriers to incorporating artists and designers on to visualization teams by enabling them to contribute their visual expertise without having to spend months learning software tools that currently limit the creative possibilities for their work.
VisIT
What it is: VisIt is the premier visualization tool for ultrascale systems. Developed by the US Department of Energy, VisIt is built from its inception to run on systems with hundreds of thousands of cores. Intelligent Light has been working to harden VisIt and overcome the limitations for production engineering use. Throughout this development we have continuously contributed to the source tree and played an important role in the established VisIt community. VisIt Prime gives users a robust, reliable and fully supported software release backed by Intelligent Light’s first class global support team.
MatPlotLib
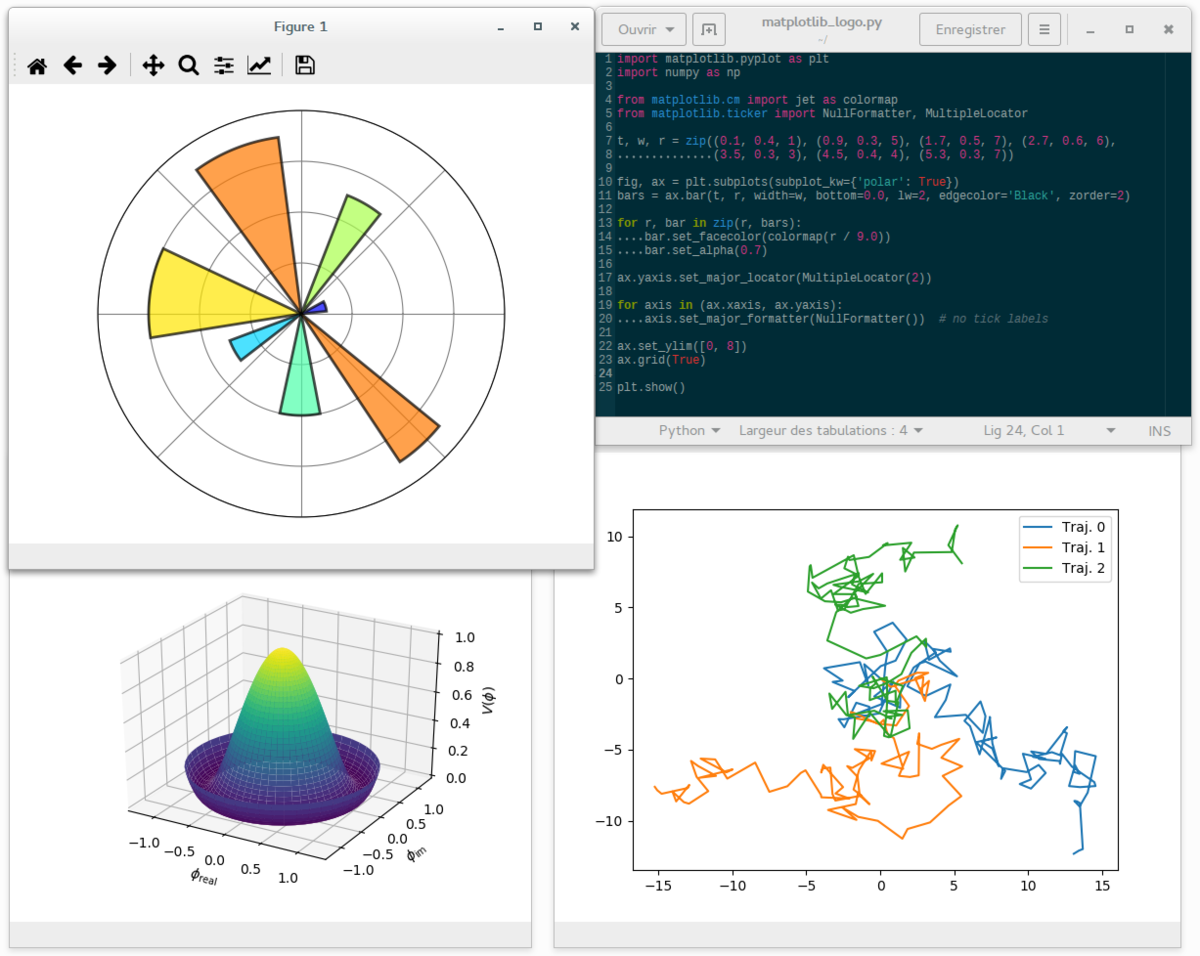
What it is: Matplotlib is a plotting library for the Python programming language and its numerical mathematics extension NumPy. It provides an object-oriented API for embedding plots into applications using general-purpose GUI toolkits like Tkinter, wxPython, Qt, or GTK+.
MatLab
What it is: MATLAB is a multi-paradigm numerical computing environment and proprietary programming language developed by MathWorks. MATLAB allows matrix manipulations, plotting of functions and data, implementation of algorithms, creation of user interfaces, and interfacing with programs written in other languages.
Cinema Viewer
What it is: Cinema is an innovative way of capturing, storing and exploring extreme scale scientific data. It is a highly interactive image-based approach to data analysis and exploration that promotes investigation of large scientific datasets, and is easily integrated into your existing workflows through extensions to widely used open source tools. This novel approach supports interactive exploration of a wide range of results, while still significantly reducing data movement and storage.
Extreme scale scientific simulations are leading a charge to exascale computation, and data analytics runs the risk of being a bottleneck to scientific discovery. Due to power and I/O constraints, we expect in situ visualization and analysis will be a critical component of these workflows. Options for extreme scale data analysis are often presented as a stark contrast: write large files to disk for interactive, exploratory analysis, or perform in situ analysis to save detailed data about phenomena that a scientists knows about in advance. We present a novel framework for a third option – a highly interactive, compact and scalable way to explore data.
Cinema is an application-neutral approach to large data analysis, visualization and exploration. The foundation of Cinema is database specifications that provide a way for common data to be written and read by any application. We provide reference implementations of exporters and viewers, but these are by no means intended to be the only applications within the Cinema community.