


SciVisColor
Color Tools and Strategies for Scientific Visualization
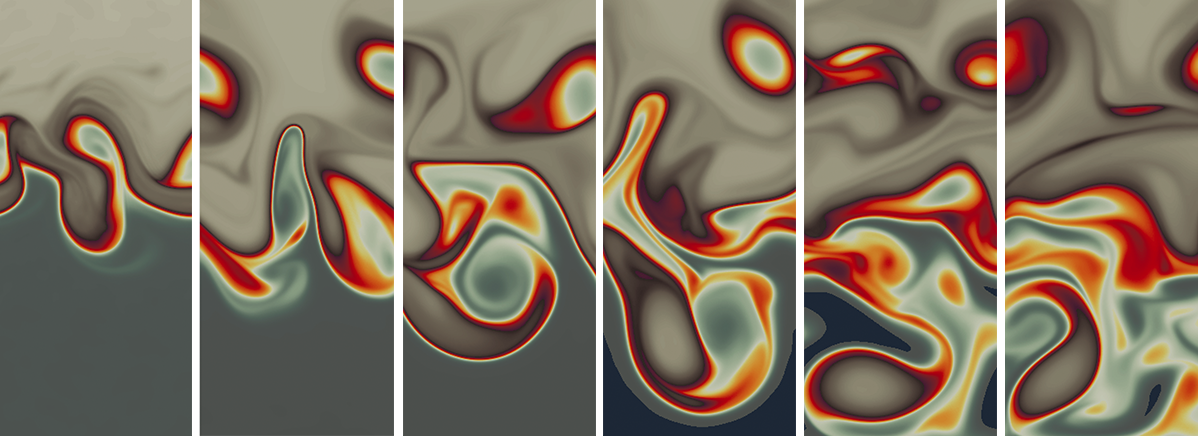
SciVisColor is a hub for research and resources related to color in scientific visualization. SciVisColor draws on expertise from the arts, computer science, data science, geoscience, mathematics, and the scientific visualization community to create tools and guides that enhance scientists’ ability to extract knowledge from their data.
As the size and complexity of data increases, scientists need tools to better explore, discover, and communicate the information within their data. While color has always been utilized and studied as a component of scientific data visualization, its full potential for discovery and communication of scientific data remains untapped.
SciVisColor addresses this gap by creating tools and providing strategies that allow scientists to use color as a tool to better understand and communicate their data.
These tools and guides have been designed with scientists’ data visualization workflow and tools in mind for ease of use. Users can explore and download:
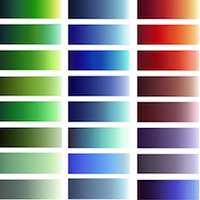
- Colormaps
- Color Sets
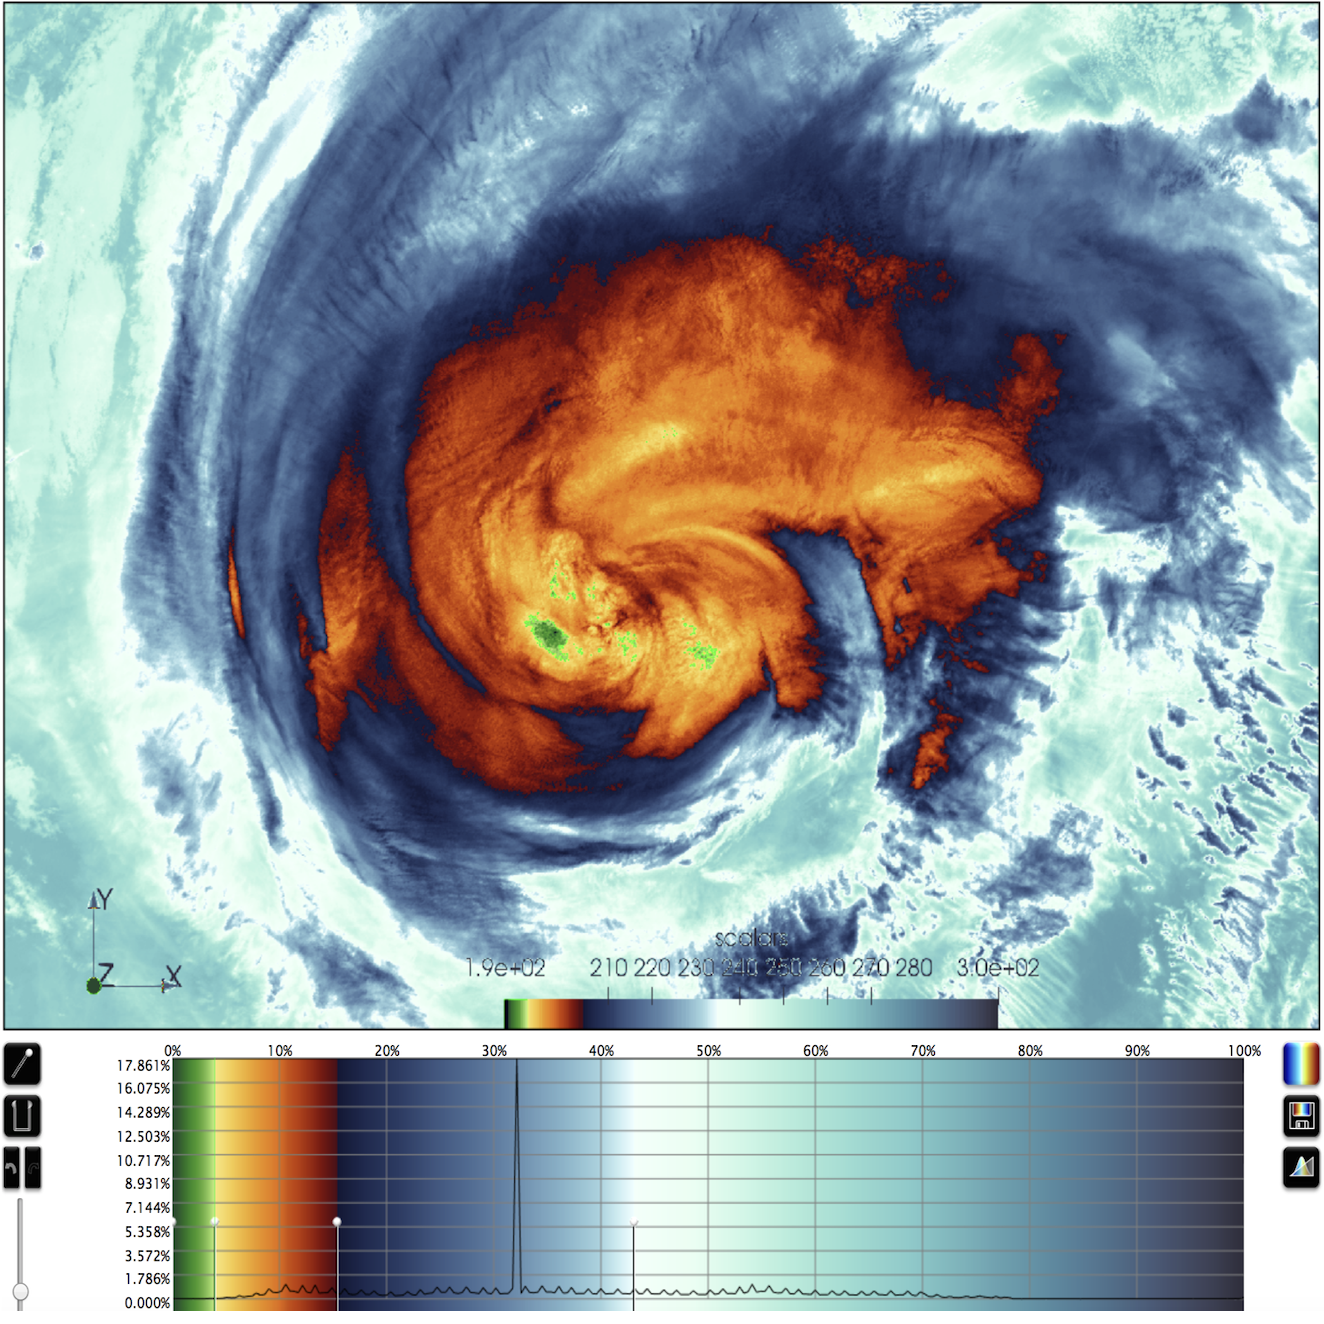
- ColorMoves: an interactive interface for using color in scientific visualization